
Google Sheets Advanced Functions: Unlocking the Power of Spreadsheets
Google Sheets Advanced Functions: Unlocking the Power of Spreadsheets
Contents
- 1 Google Sheets Advanced Functions: Unlocking the Power of Spreadsheets
- 2 Why Advanced Google Sheets Functions Matter
- 3 Essential Advanced Google Sheets Functions
- 4 Practical Business Use Cases
- 5 Step‑by‑Step Guide: Build an Automated Report with QUERY
- 6 Tips for Optimizing Google Sheets in Google Workspace
- 7 FAQ
- 8 Conclusion
- 9 Call to Action
Introduction
Google Sheets is far more than a simple spreadsheet tool, it’s a powerful data analysis platform inside the Google Workspace collaboration ecosystem. While many users rely on basic formulas like SUM or AVERAGE, advanced functions allow teams to automate reporting, analyze large datasets, and connect data across multiple sources.
For professionals, team leaders, and IT administrators using Google Workspace collaboration tools, mastering advanced Google Sheets functions can dramatically improve productivity, reduce manual work, and enable smarter decision‑making.
In this guide, we’ll explore powerful Google Sheets functions, practical use cases, and step‑by‑step examples that help you unlock the full potential of spreadsheets.
Why Advanced Google Sheets Functions Matter
Modern teams manage massive volumes of data—sales reports, customer feedback, marketing analytics, and operational metrics. Advanced functions allow you to:
- Automate repetitive calculations
- Extract insights from large datasets
- Combine data across multiple sheets or files
- Create dynamic dashboards for teams
- Improve collaboration across Google Workspace tools like Google Drive and Google Docs
When used correctly, these features turn Google Sheets into a lightweight data platform.
Essential Advanced Google Sheets Functions
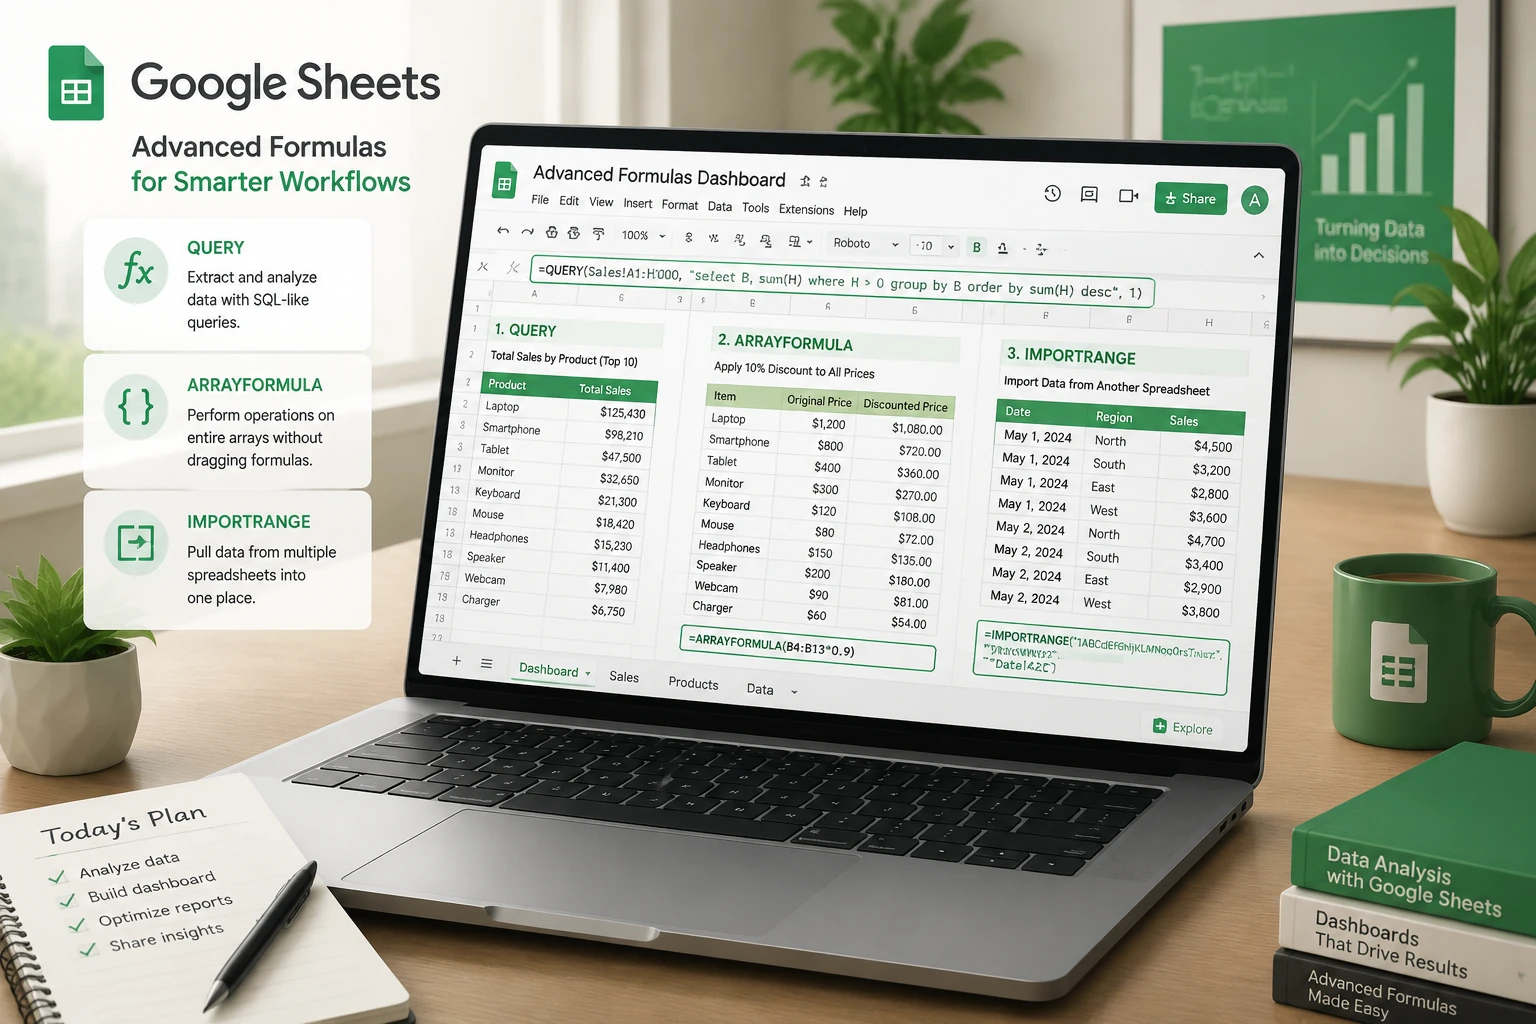
1. QUERY Function
The QUERY function is one of the most powerful tools in Google Sheets. It allows you to analyze and filter data using SQL-like syntax.
Example
=QUERY(A1:D100, "SELECT A, C WHERE B='Marketing'", 1)
This formula extracts rows where the department equals Marketing and displays only specific columns.
Common Uses
- Filtering data sets
- Creating reports
- Building dashboards
- Sorting and grouping data

2. ARRAYFORMULA
ARRAYFORMULA allows a single formula to process multiple rows automatically.
Instead of copying formulas down a column, you apply it once.
Example
=ARRAYFORMULA(A2:A * B2:B)
This multiplies entire columns automatically.
Benefits
- Eliminates repetitive formulas
- Automatically applies to new rows
- Perfect for automated workflows
Business Use Case
A finance team calculating total revenue for hundreds of orders without manually dragging formulas.

3. IMPORTRANGE
IMPORTRANGE allows you to pull data from another spreadsheet stored in Google Drive.
Example
=IMPORTRANGE("spreadsheet_URL","SalesData!A1:D100")
Use Cases
- Consolidating reports from multiple departments
- Connecting marketing and sales dashboards
- Centralizing data for executives

4. VLOOKUP / XLOOKUP Alternatives
VLOOKUP searches for values in a table and returns matching results.
Example
=VLOOKUP(A2, Sheet2!A:B, 2, FALSE)
Business Example
Match employee IDs with employee names from a master database.
Tip
For more flexibility, combine with INDEX and MATCH.
Example:
=INDEX(B:B, MATCH(A2, A:A, 0))

5. FILTER Function
The FILTER function dynamically extracts specific rows from a dataset.
Example
=FILTER(A2:D100, B2:B="Sales")
Benefits
- Real-time filtering
- Ideal for dashboards
- Easy alternative to pivot tables
Practical Business Use Cases
1. Automated Sales Dashboard
A sales manager can use:
IMPORTRANGEto pull regional reportsQUERYto filter by product or regionARRAYFORMULAto calculate totals
Result:
A real-time dashboard updating automatically across the company’s Google Workspace environment.
2. Marketing Campaign Tracking
Marketing teams can combine data from multiple sources:
- Google Ads export
- Email campaign metrics
- CRM exports
Functions used:
QUERYFILTERVLOOKUP
Outcome:
Unified campaign performance analysis.
3. HR Data Management
HR teams managing employee records can:
- Automatically match employee IDs
- Track attendance
- Generate department reports
Using functions like:
INDEX + MATCHARRAYFORMULAQUERY
Step‑by‑Step Guide: Build an Automated Report with QUERY
Step 1: Prepare Your Dataset
Create a table with columns like:
- Employee Name
- Department
- Sales
- Region
Step 2: Insert the QUERY Formula
=QUERY(A1:D100,"SELECT B, SUM(C) GROUP BY B",1)
This groups total sales by department.
Step 3: Create a Dashboard Section
Use charts to visualize:
- Sales by department
- Regional performance
- Monthly growth
Insert chart:
Insert → Chart → Choose visualization.
Use Google Drive sharing settings to allow team members to view or edit the dashboard.
Tips for Optimizing Google Sheets in Google Workspace
- Store spreadsheets in Google Drive for secure collaboration
- Use protected ranges to prevent accidental edits
- Combine Sheets with Google Forms for automated data collection
- Connect Sheets with Looker Studio dashboards for visual reporting
FAQ
1. What are advanced Google Sheets functions?
Advanced functions like QUERY, ARRAYFORMULA, and IMPORTRANGE allow users to automate calculations, filter data, and connect spreadsheets across Google Workspace.
2. Is Google Sheets powerful enough for business analytics?
Yes. While not a full BI tool, Google Sheets can perform powerful data analysis and integrate with tools like Looker Studio.
3. What is the most powerful function in Google Sheets?
Many experts consider QUERY the most powerful because it allows SQL-like data analysis directly in spreadsheets.
4. Can Google Sheets connect to other spreadsheets automatically?
Yes, using IMPORTRANGE, which pulls data from other Google Sheets files stored in Google Drive.
5. Are these functions useful for teams?
Absolutely. They enable real-time collaboration, automation, and shared reporting across Google Workspace teams.
Conclusion
Advanced Google Sheets functions unlock a new level of productivity for teams using Google Workspace collaboration tools. By mastering functions like QUERY, ARRAYFORMULA, and IMPORTRANGE, professionals can automate reporting, analyze large datasets, and build powerful dashboards without leaving Google Sheets.
Whether you’re a manager tracking performance metrics or an IT administrator optimizing data workflows, these features transform spreadsheets into a powerful decision‑making tool.
Call to Action
Ready to level up your Google Workspace productivity?
For more productivity tips, explore our related guides:
YouTube Channel: https://www.youtube.com/@TechTrickswithEli2023
Telegram Channel: https://t.me/techtrickswithEli
Mastering Real-Time Collaboration in Google Docs: A Complete Guide for Teams
Start building smarter spreadsheets today and unlock the full power of Google Workspace.